
Nine campaigns.Every one counted.
These are campaigns we ran. The first two are Google Ads accounts we run now, with the figures read from each client's own account. The rest are copied from the write-ups we published at the time. Client names are withheld, and each entry says how its result was counted: a phone call, a store visit, an order.
- Published campaign 9 on this page. A real campaign, with its figures.
- Illustrative example 1 on this page. A worked example of method, not a client.
 Illustrative image
What ran, and what it was counted in.
- Published campaign3 years, Nov 2023 to Oct 2026
A law firm on Google Ads: from 10 leads a year to 654
A regional law firm: personal injury, criminal defense and family law
- Real leads in the last 12 months
- 654
- Cost per lead, down from $1,142
- $41
- Leads a year, against the year before
- 65×

- Published campaign10 months, 2026
Pest control on Google Ads: 4.6× the leads at 42% less each
A residential and commercial pest control company
- Leads a month, up from 287
- 1,316
- Cost per lead, down from $38
- $22
- New-customer leads a month, up from 97
- 381
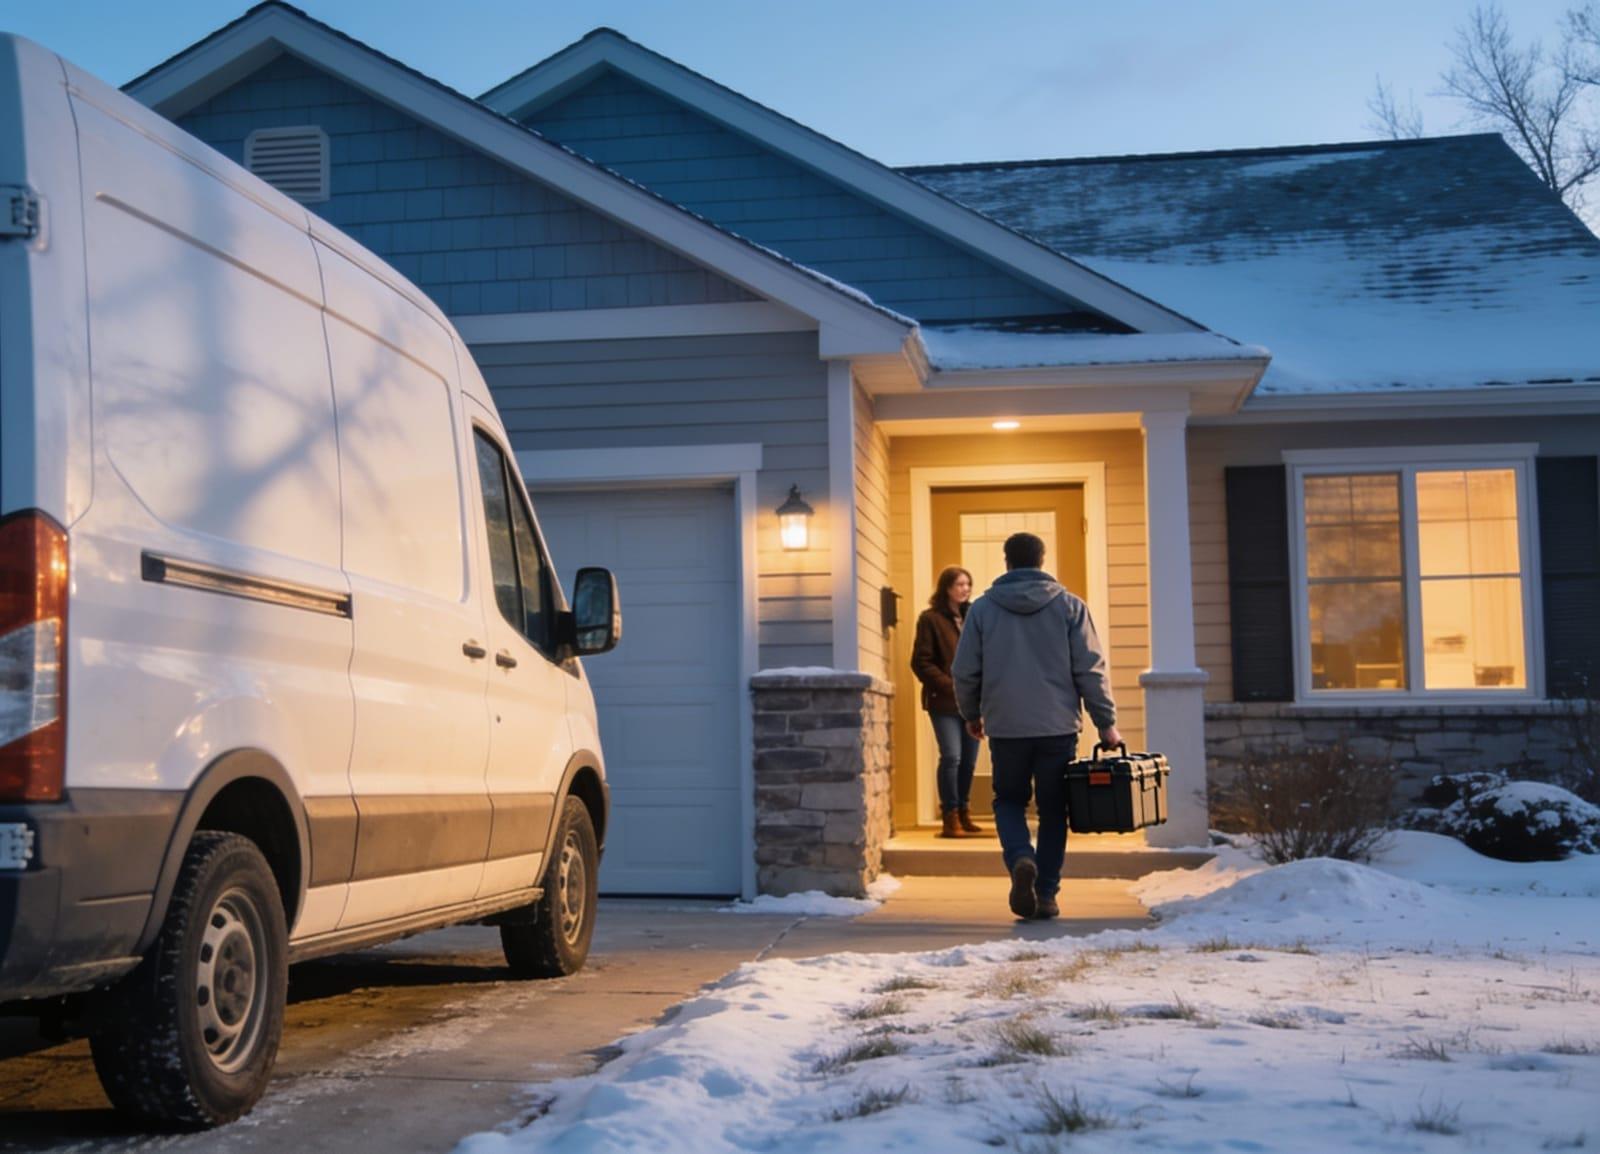
- Published campaign2 months, 2018
Outdoor apparel on Connected TV, checked against order IDs
An outdoor apparel and equipment company that sells online
- Return on ad spend (ROAS)
- 17.9
- Average view-through rate (VTR)
- 98.2%
- Blended cost per acquisition (CPA)
- $8.23

- Published campaign6 months
Counting showroom visits for a car dealership
A car dealership
- Store visits
- 303
- Geo lift
- 263.3%
- Impressions
- 1,440,436

- Published campaign3 months
A take-out special for a pizza chain, counted at pickup
A pizza chain with locations in major metropolitan areas
- Store visits
- 888
- Geo lift
- 269.7%
- Impressions
- 402,525

- Published campaign30 days
Thirty days of digital audio for a retailer
A retail client
- Store visits
- 23,419
- Cost per store visit
- $2.95
- Impressions
- 14,799,119

- Published campaign6 weeks
Six weeks to bring shoppers into furniture showrooms
A furniture chain with several stores in one region
- Store visits
- 163
- Geo lift
- 53.43%
- Impressions
- 1,082,751

- Published campaign4 months
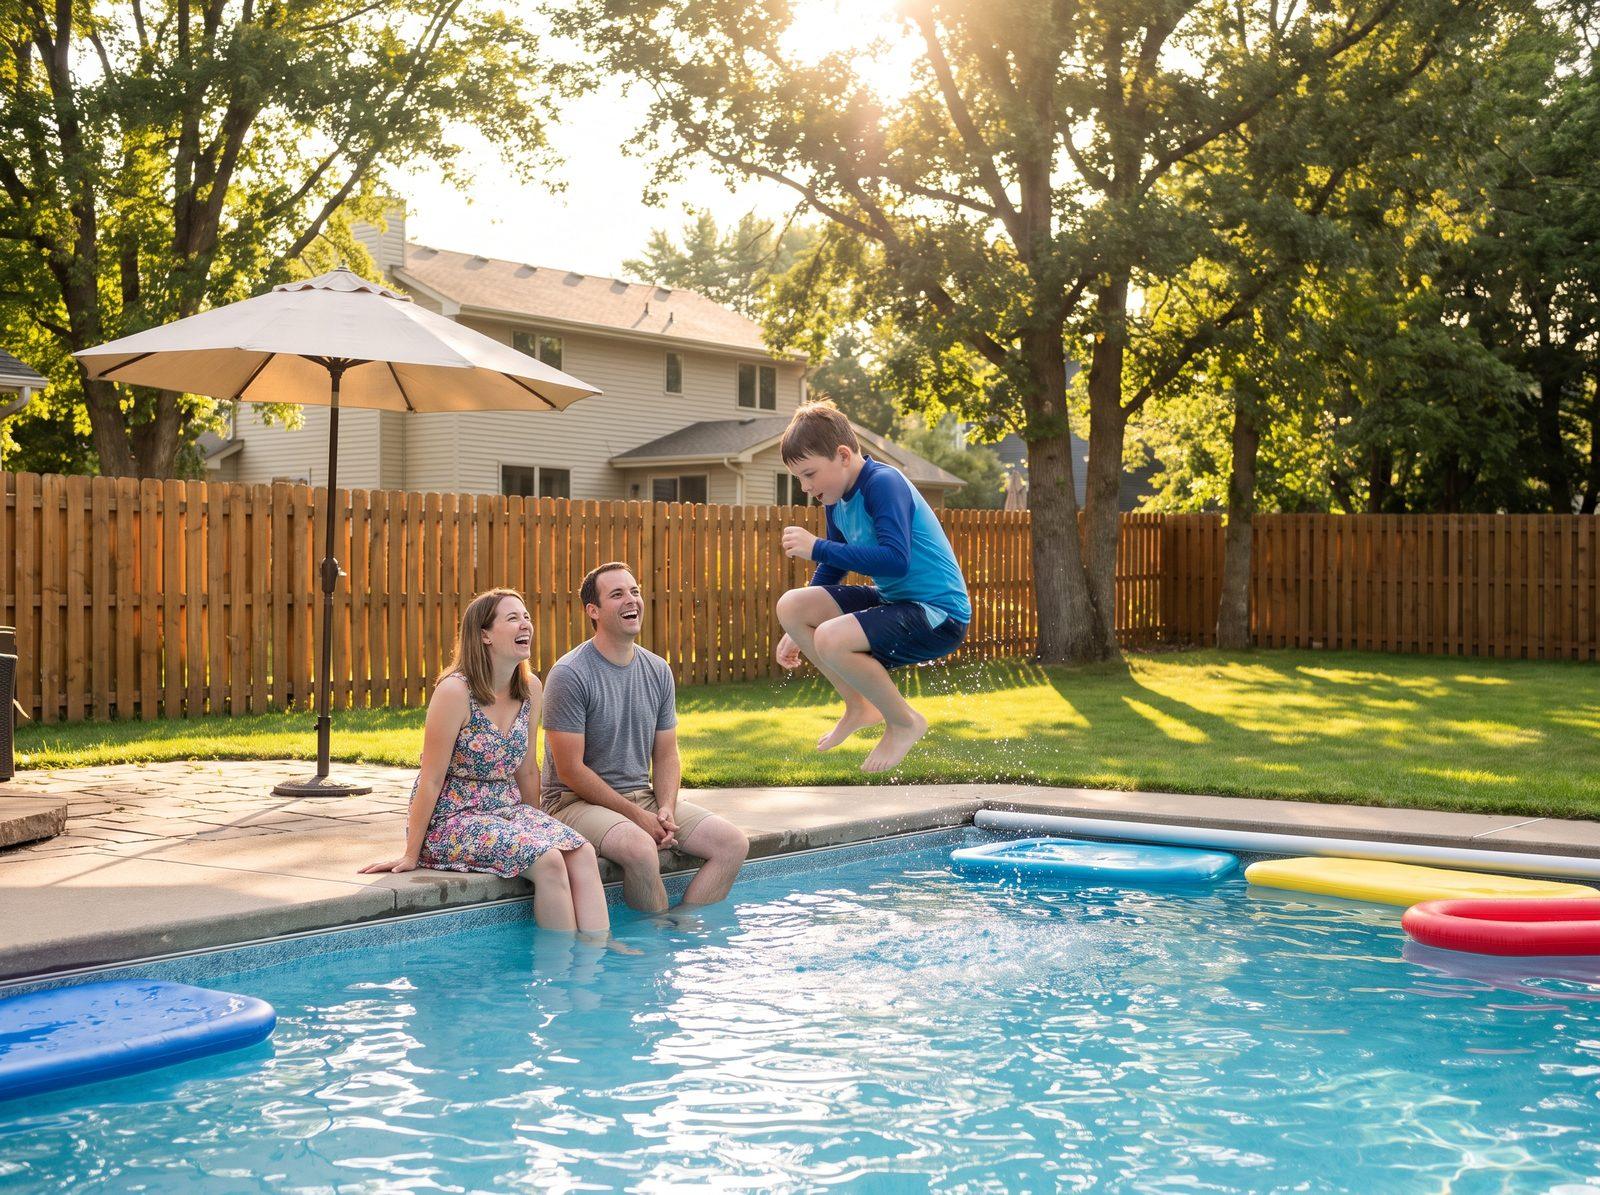
Store traffic for a pool and spa specialist
A pool and spa specialist with its own stores
- Store visits
- 1,233
- Impressions, GPS retargeting
- 3,036,020
- Impressions, Geotargeting
- 11,913,554
- Published campaign4 months
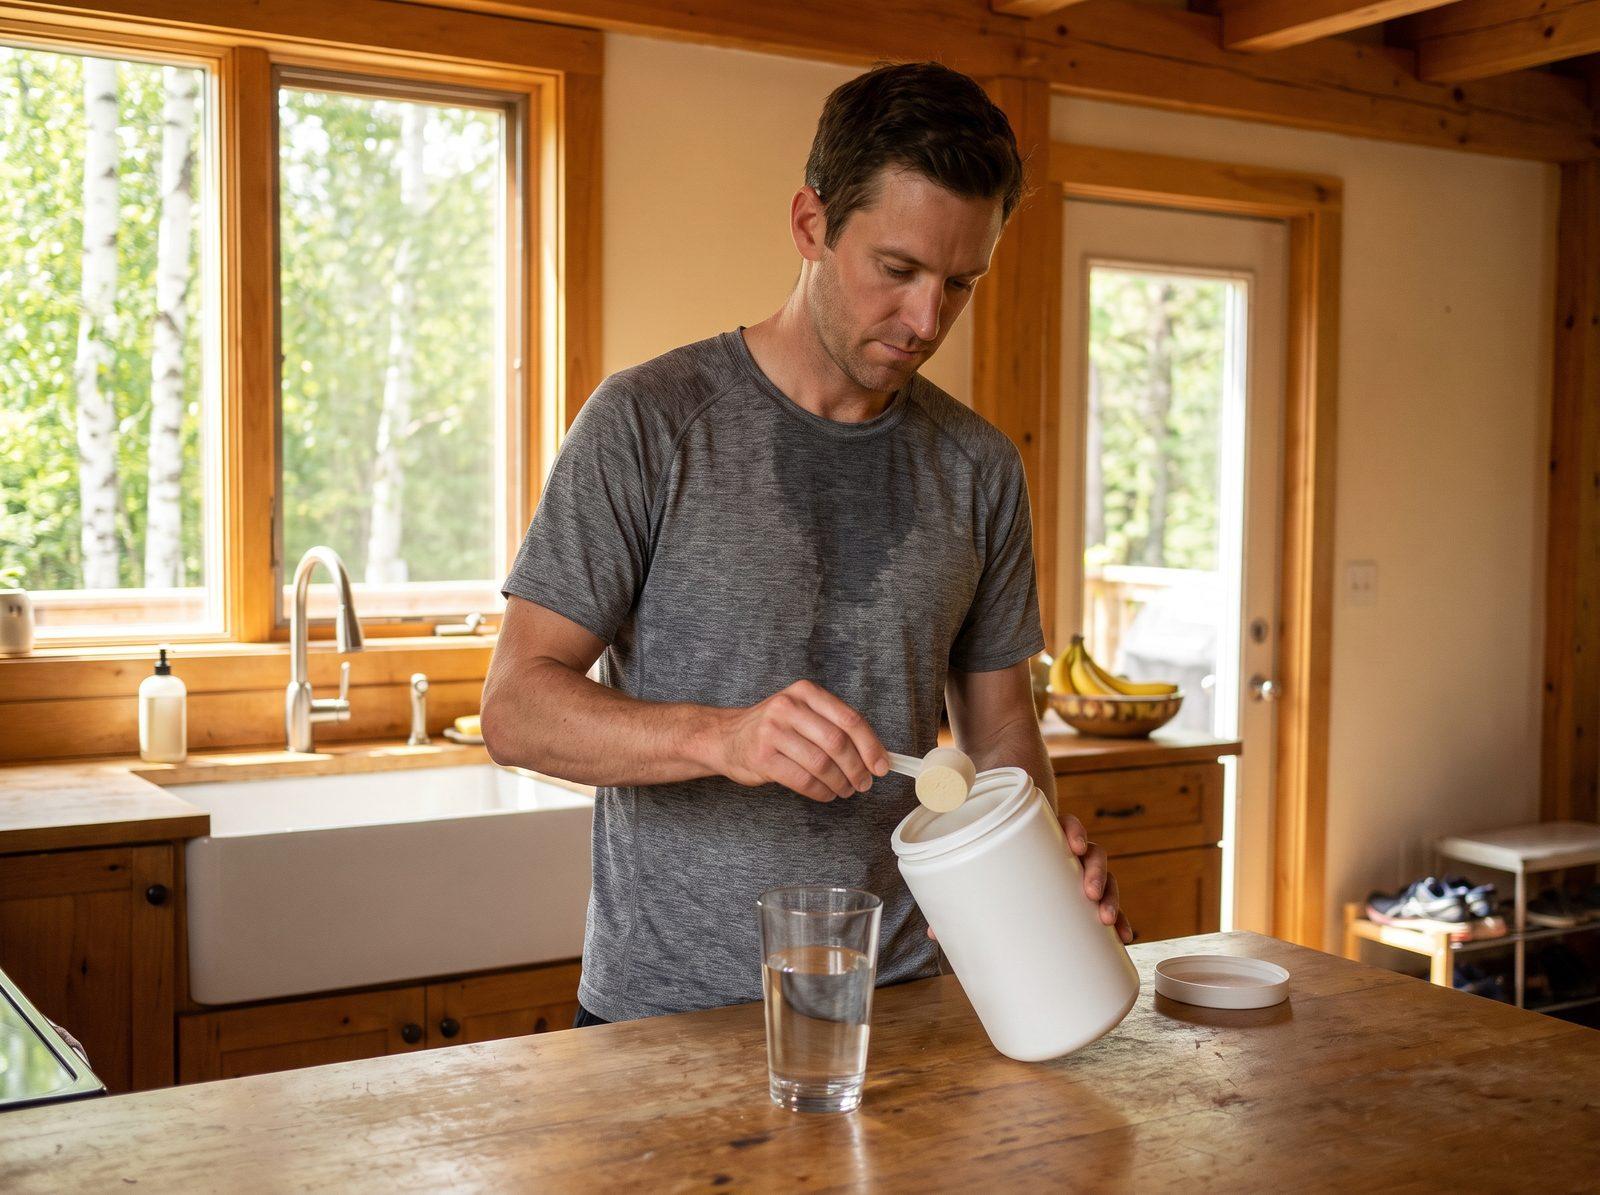
Finding new online buyers for a supplement company
An international nutritional supplement company
- Purchases
- 297
- Of total online sales, as the original labels it
- 20.2%
- Impressions
- 2,946,879
- Illustrative exampleA six-month plan
Growing deposits by reaching fewer, better-matched households
A community bank (an example, not a client)
A worked example of method. Its figures are examples and sit on its own page, labelled.
Read the study
Client names are withheld. One entry is a worked example, not a client: its figures are illustrative, and it is labelled wherever it appears. A past result is not a forecast. Yours will depend on your market, your budget and your offer.
A campaign is read in order.
Most of the campaigns above were counted at the store door. A Connected TV campaign is read the same honest way, one month at a time, and every month you get a plain-English report of what ran and what moved.
90 to 98% of viewers watch to the end on real Connected TV inventory. If a campaign runs under about 90%, something is wrong with the supply or the file, and we go and find it.
- Month 1
Delivery and frequency
Did the commercial reach the right households, and often enough to register? Leads tell you nothing this early.
- Month 2
Search and site visits
Branded search and direct traffic usually start to move, if the creative and the geography are right.
- Month 3
Lift against a baseline
Often 10 to 25% over where you started, on site or store activity, when measurement was set up at the beginning. A typical range, not a promise.
Want the full story on one of these?
Ask us how any campaign here was built and counted. We will walk you through it.